Overview
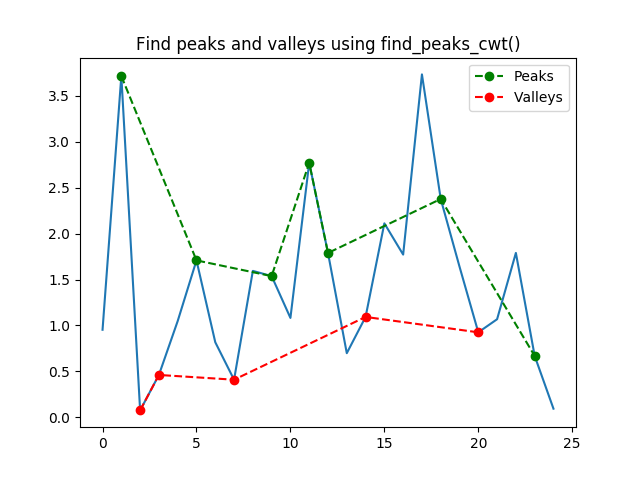
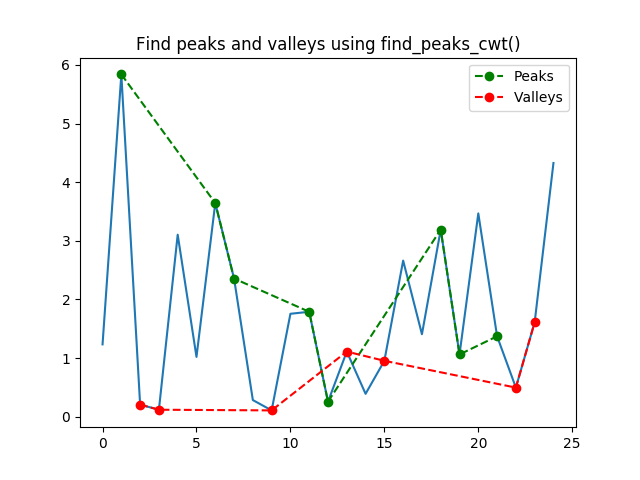
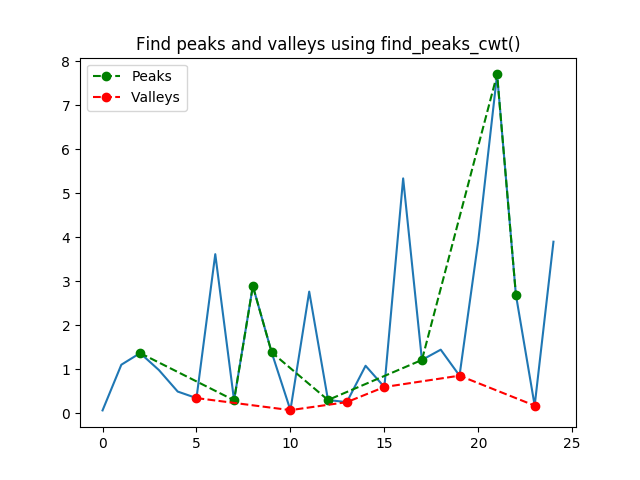
I was trying to find a function that returns peaks and valleys of a graph. I tested scipy.signal.find_peaks_cwt() but it turns out to be not suitable for my use case. It looks like it is only suitable to handle signal graph. After all, the function is under the signal package. See Chart output section below for good and bad cases.
Code to find peaks and valleys - Failed
#!/usr/bin/python3
import matplotlib
matplotlib.use('Agg') # Bypass the need to install Tkinter GUI framework

from scipy import signal
import numpy as np
import matplotlib.pyplot as plt

# Generate random data.
data_x = np.arange(start = 0, stop = 25, step = 1, dtype='int')
data_y = np.random.normal(loc = 0, scale = 1, size = 25)*2
data_y = np.absolute(data_y) # Want positive numbers only.

# Find peaks(max)
widths=np.arange(1,4) # Widths range should cover the expected width of peaks of interest.
peak_indexes = signal.find_peaks_cwt(data_y, widths)

# Find valleys(min)
inv_data_y = data_y*(-1) # Tried 1/data_y but not better.
valley_indexes = signal.find_peaks_cwt(inv_data_y, widths)

# Plot main graph
(fig, ax) = plt.subplots()
ax.plot(data_x, data_y)

# Plot peaks
peak_x = peak_indexes
peak_y = data_y[peak_indexes]
ax.plot(peak_x, peak_y, marker='o', linestyle='dashed', color='green', label="Peaks")

# Plot valleys
valley_x = valley_indexes
valley_y = data_y[valley_indexes]
ax.plot(valley_x, valley_y, marker='o', linestyle='dashed', color='red', label="Valleys")


# Save graph to file.
plt.title('Find peaks and valleys using find_peaks_cwt()')
plt.legend(loc='best')
plt.savefig('scipypeak.png')
Chart ouput
More or less good case

Bad case


