Overview
I was trying to find the peaks and valleys of a graph. After going through multiple functions and libraries, alas, I finally found the solution. It is an elegant and simple function. It is called scipy.signal.argrelextrema().
Find peaks and valleys using argrelextrema()
#!/usr/bin/python3
import matplotlib
matplotlib.use('Agg') # Bypass the need to install Tkinter GUI framework

from scipy import signal
import numpy as np
import matplotlib.pyplot as plt

# Generate random data.
data_x = np.arange(start = 0, stop = 25, step = 1, dtype='int')
data_y = np.random.random(25)*6

# Find peaks(max).
peak_indexes = signal.argrelextrema(data_y, np.greater)
peak_indexes = peak_indexes[0]

# Find valleys(min).
valley_indexes = signal.argrelextrema(data_y, np.less)
valley_indexes = valley_indexes[0]

# Plot main graph.
(fig, ax) = plt.subplots()
ax.plot(data_x, data_y)

# Plot peaks.
peak_x = peak_indexes
peak_y = data_y[peak_indexes]
ax.plot(peak_x, peak_y, marker='o', linestyle='dashed', color='green', label="Peaks")

# Plot valleys.
valley_x = valley_indexes
valley_y = data_y[valley_indexes]
ax.plot(valley_x, valley_y, marker='o', linestyle='dashed', color='red', label="Valleys")


# Save graph to file.
plt.title('Find peaks and valleys using argrelextrema()')
plt.legend(loc='best')
plt.savefig('argrelextrema.png')
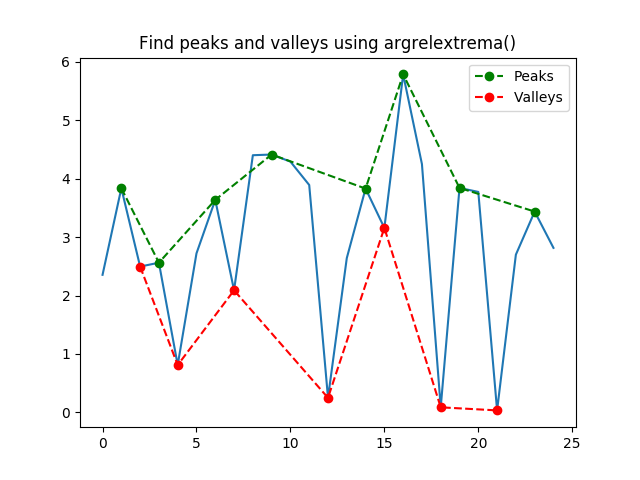
Chart output
An example on random data

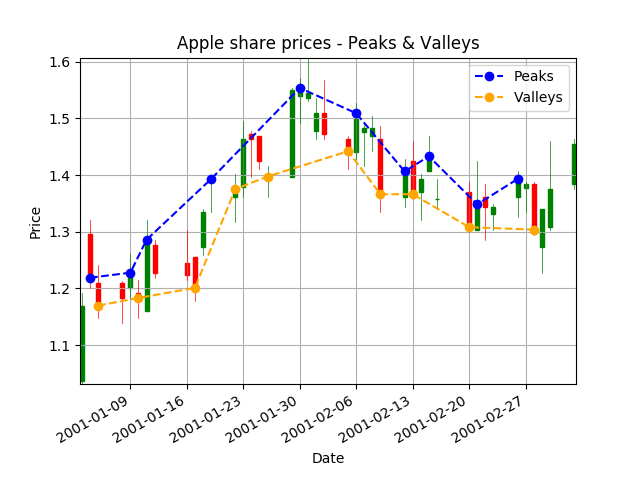
An example on Apple share prices for a period of 45 days


