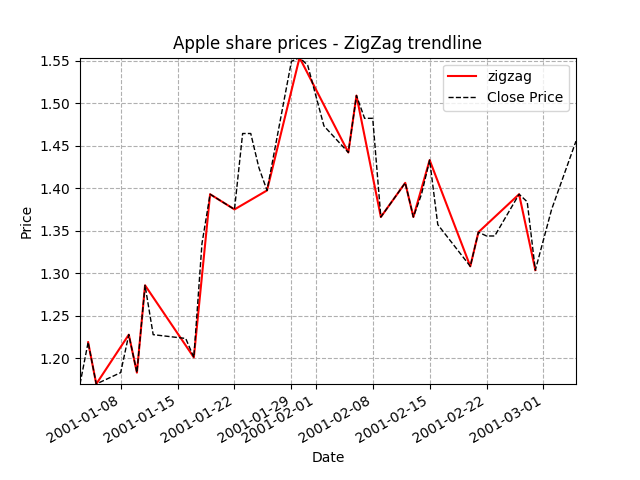
In Python, to draw a zigzag trendline of stock prices, you need to first find the peak and valley values of the chart. This can be done by using scipy.signal.argrelextrema() function. Then, you have to combine them together and sort them in chronological order. After this, you end up forming a zigzag trendline. The code below show you how to draw a zigzag trendline of Apple stock prices. It is assumed that you have the following libraries installed on your computer:
- numpy:
pip install numpy - matplotlib:
pip install matplotlib - pandas:
pip install pandas - scipy:
pip install scipy
The code
#!/usr/bin/python3
import matplotlib
matplotlib.use('Agg') # Bypass the need to install Tkinter GUI framework

# Avoid FutureWarning: Pandas will require you to explicitly register matplotlib converters.
from pandas.plotting import register_matplotlib_converters
register_matplotlib_converters()

from scipy import signal
import numpy as np
import matplotlib.pyplot as plt
import matplotlib.dates as mdates

import pandas as pd

# Load data from CSV file.
##########################
my_headers = ['date', 'open', 'high', 'low', 'close', 'volume']
my_dtypes = {'date': 'str', 'open': 'float', 'high': 'float', 'low': 'float',
                                                'close': 'float', 'volume': 'int'}
my_parse_dates = ['date']
loaded_data = pd.read_csv('apple.csv', sep='\t', header=1, names=my_headers,
                            dtype=my_dtypes, parse_dates=my_parse_dates)


# Convert 'Timestamp' to 'float'.
#   Need time be in float days format - see date2num.
loaded_data['date'] = [mdates.date2num(d) for d in loaded_data['date']]

# Re-arrange so that each line contains values of a day: 'date','open','high','low','close'.
quotes = [tuple(x) for x in loaded_data[['date','open','high','low','close']].values]


# Create zigzag trendline.
########################################
# Find peaks(max).
data_x = loaded_data['date'].values
data_y = loaded_data['close'].values
peak_indexes = signal.argrelextrema(data_y, np.greater)
peak_indexes = peak_indexes[0]

# Find valleys(min).
valley_indexes = signal.argrelextrema(data_y, np.less)
valley_indexes = valley_indexes[0]

# Instantiate axes.
(fig, ax) = plt.subplots()

# Merge peaks and valleys data points using pandas.
df_peaks = pd.DataFrame({'date': data_x[peak_indexes], 'zigzag_y': data_y[peak_indexes]})
df_valleys = pd.DataFrame({'date': data_x[valley_indexes], 'zigzag_y': data_y[valley_indexes]})
df_peaks_valleys = pd.concat([df_peaks, df_valleys], axis=0, ignore_index=True, sort=True)

# Sort peak and valley datapoints by date.
df_peaks_valleys = df_peaks_valleys.sort_values(by=['date'])

# Plot zigzag trendline.
ax.plot(df_peaks_valleys['date'].values, df_peaks_valleys['zigzag_y'].values,
                                                        color='red', label="zigzag")

# Plot close price line.
ax.plot(data_x, data_y, linestyle='dashed', color='black', label="Close Price", linewidth=1)


# Customize graph.
##########################
plt.xlabel('Date')
plt.ylabel('Price')
plt.title('Apple share prices - ZigZag trendline')

# Format time.
ax.xaxis_date()
ax.xaxis.set_major_formatter(mdates.DateFormatter("%Y-%m-%d"))

plt.gcf().autofmt_xdate()   # Beautify the x-labels
plt.autoscale(tight=True)

plt.legend(loc='best')
plt.grid(True, linestyle='dashed')

# Save graph to file.
plt.savefig('argrelextrema-zigzag.png')
Output

apple.csv sample data
date open    high    low close   volume
2001-01-02  1.062500    1.089286    1.040179    1.062500    113078000
2001-01-03  1.035714    1.191964    1.031250    1.169643    204268400
2001-01-04  1.295757    1.321429    1.200893    1.218750    184849000
2001-01-05  1.209821    1.241071    1.147321    1.169643    103089000
2001-01-08  1.209821    1.213164    1.138393    1.183036    93424800

