Good news!
The mpl-finance package of matplotlib has been unmaintained for quite some time now.
Luckily, in November 2019, Daniel Goldfarb picked up the project and became the maintainer.
The project is forked into the new project at https://github.com/matplotlib/mplfinance.
The new API is even easier to use than before.
Here is how to install and use it.
Install
pip install --upgrade mplfinance
Draw candlestick chart
import pandas as pd
import mplfinance as mpf

# Load data file.
df = pd.read_csv('SP500_NOV2019_Hist.csv', index_col=0, parse_dates=True)

# Plot candlestick.
# Add volume.
# Add moving averages: 3,6,9.
# Save graph to *.png.
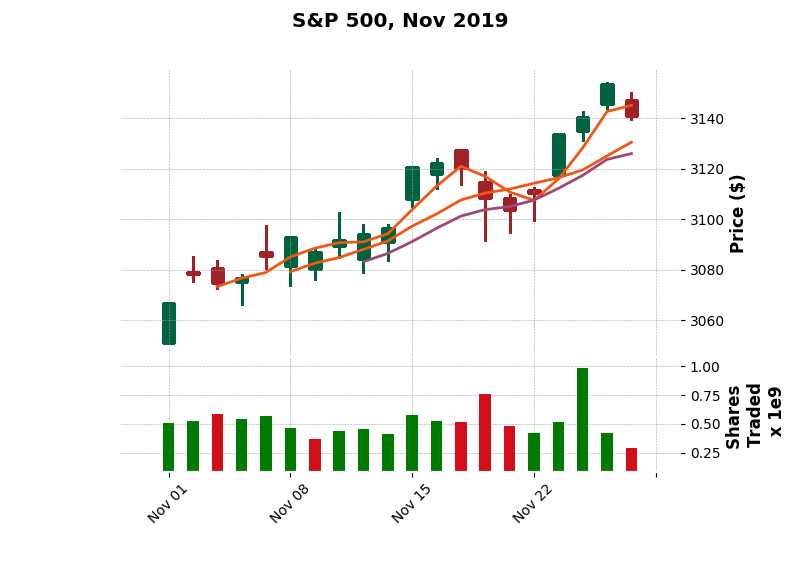
mpf.plot(df, type='candle', style='charles',
            title='S&P 500, Nov 2019',
            ylabel='Price ($)',
            ylabel_lower='Shares \nTraded',
            volume=True,
            mav=(3,6,9),
            savefig='test-mplfiance.png')
Output chart

Test data
- https://raw.githubusercontent.com/matplotlib/mplfinance/master/examples/data/SP500_NOV2019_Hist.csv

