Overview
matplotlib.finance module is removed from Matplotlib v2.2.
The source codes are put at https://github.com/matplotlib/mpl_finance.
The current repository is not maintained as no one is willing to pick it up.
However, you can still use it by installing it from github. But, Yahoo data feed will not work.
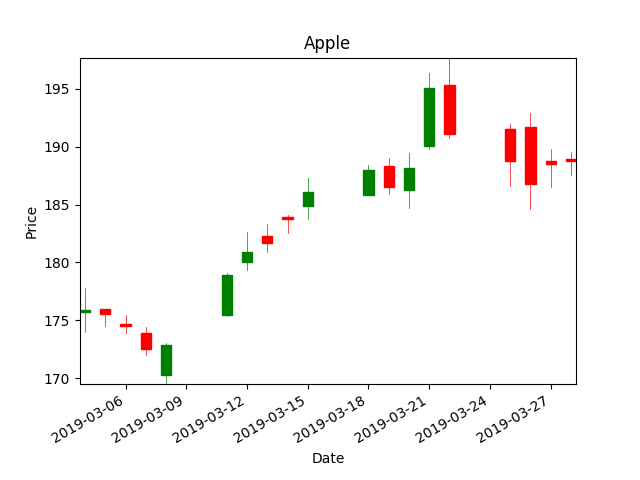
The code below shows how to draw candlestick chart using mpl_finance by fetching data from CSV file.
Installation
pip install https://github.com/matplotlib/mpl_finance/archive/master.zip
Draw candlestick
#!/usr/bin/python3
# Ref: https://matplotlib.org/api/finance_api.html

import pandas as pd
from mpl_finance import candlestick_ohlc

import matplotlib
matplotlib.use('Agg') # Bypass the need to install Tkinter GUI framework
import matplotlib.pyplot as plt
import matplotlib.dates as mdates

# Avoid FutureWarning: Pandas will require you to explicitly register matplotlib converters.
from pandas.plotting import register_matplotlib_converters
register_matplotlib_converters()


# Load data from CSV file.
##########################
my_headers = ['date', 'open', 'high', 'low', 'close', 'volume']
my_dtypes = {'date': 'str', 'open': 'float', 'high': 'float', 'low': 'float',
                                                'close': 'float', 'volume': 'int'}
my_parse_dates = ['date']
loaded_data = pd.read_csv('apple.csv', sep='\t', header=1, names=my_headers,
                            dtype=my_dtypes, parse_dates=my_parse_dates)


# Convert 'Timestamp' to 'float'.
#   candlestick_ohlc needs time to be in float days format - see date2num().
loaded_data['date'] = [mdates.date2num(d) for d in loaded_data['date']]

# Re-arrange data so that each row contains values of a day: 'date','open','high','low','close'.
quotes = [tuple(x) for x in loaded_data[['date','open','high','low','close']].values]

# Plot candlestick.
##########################
fig, ax = plt.subplots()
candlestick_ohlc(ax, quotes, width=0.5, colorup='g', colordown='r');


# Customize graph.
##########################
plt.xlabel('Date')
plt.ylabel('Price')
plt.title('Apple')

# Format time.
ax.xaxis_date()
ax.xaxis.set_major_formatter(mdates.DateFormatter("%Y-%m-%d"))

plt.gcf().autofmt_xdate()   # Beautify the x-labels
plt.autoscale(tight=True)

# Save graph to file.
plt.savefig('mpl_finance-apple.png')
Output chart

Input data: apple.csv
date open    high    low close   volume
2019-03-01  174.279999  175.149994  172.889999  174.970001  25873500
2019-03-04  175.690002  177.750000  173.970001  175.850006  27436200
2019-03-05  175.940002  176.000000  174.539993  175.529999  19737400
2019-03-06  174.669998  175.490005  173.940002  174.520004  20810400
2019-03-07  173.869995  174.440002  172.020004  172.500000  24796400
2019-03-08  170.320007  173.070007  169.500000  172.910004  23989900
2019-03-11  175.490005  179.119995  175.350006  178.899994  31964000
2019-03-12  180.000000  182.669998  179.369995  180.910004  32467600
2019-03-13  182.250000  183.300003  180.919998  181.710007  30970100
2019-03-14  183.899994  184.100006  182.559998  183.729996  23579500
2019-03-15  184.850006  187.330002  183.740005  186.119995  39025100
2019-03-18  185.800003  188.389999  185.789993  188.020004  26196000
2019-03-19  188.350006  188.990005  185.919998  186.529999  31529400
2019-03-20  186.229996  189.490005  184.729996  188.160004  31018400
2019-03-21  190.020004  196.330002  189.809998  195.089996  50980100
2019-03-22  195.339996  197.690002  190.779999  191.050003  42359300
2019-03-25  191.509995  191.979996  186.600006  188.740005  43765700
2019-03-26  191.660004  192.880005  184.580002  186.789993  49719500
2019-03-27  188.750000  189.759995  186.550003  188.470001  29598500
2019-03-28  188.949997  189.559998  187.529999  188.720001  20639200

