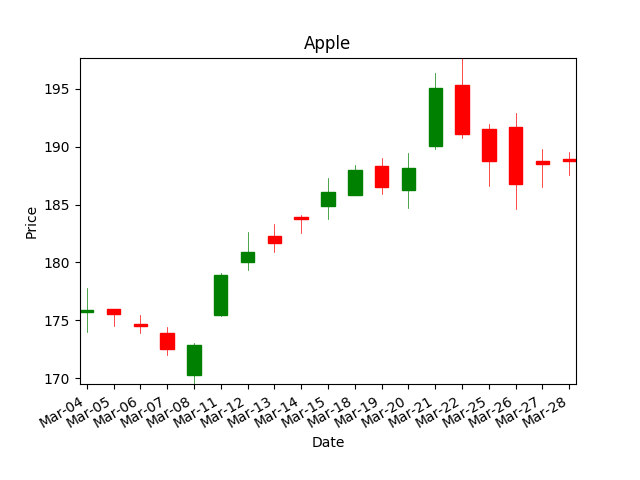
The deprecated mpl_finance module provides the candlestick_ochl(ax, quotes, ...) function that can create candlestick chart but it doesn't handle time gaps due to weekends and holidays. Besides, the quotes parameter requires time elements to be in float days format.
With these constraints, we can solve this gap issue by doing the followings:
- Instead of passing dates to time, pass a list of contiguous sequence of incremental integers;
loaded_data['date'] = np.arange(start = 0, stop = data_size, step = 1, dtype='int')
- Then, go through each xtick label and then name it with a date string:
x_tick_labels = []
for l_date in x_dates:
    date_str = l_date.strftime('%b-%d')
    x_tick_labels.append(date_str)
ax.set(xticks=loaded_data['date'], xticklabels=x_tick_labels)
Draw candlestick chart without gaps
#!/usr/bin/python3
import numpy as np
import pandas as pd
from mpl_finance import candlestick_ohlc

import matplotlib
matplotlib.use('Agg') # Bypass the need to install Tkinter GUI framework
import matplotlib.pyplot as plt

# Load data from CSV file.
##########################
my_headers = ['date', 'open', 'high', 'low', 'close', 'volume']
my_dtypes = {'date': 'str', 'open': 'float', 'high': 'float', 'low': 'float',
                                                'close': 'float', 'volume': 'int'}
my_parse_dates = ['date']
loaded_data = pd.read_csv('apple.csv', sep='\t', header=1, names=my_headers,
                            dtype=my_dtypes, parse_dates=my_parse_dates)

# Preserve dates to be re-labelled later.
x_dates = loaded_data['date']

# Override loaded_data['date'] with a list of incrementatl integers.
#   This will not create gaps in the candle stick graph.
data_size = len(loaded_data['date'])
loaded_data['date'] = np.arange(start = 0, stop = data_size, step = 1, dtype='int')

# Re-arrange so that each line contains values of a day: 'date','open','high','low','close'.
quotes = [tuple(x) for x in loaded_data[['date','open','high','low','close']].values]

# Plot candlestick.
##########################
fig, ax = plt.subplots()
candlestick_ohlc(ax, quotes, width=0.5, colorup='g', colordown='r');

# Go through each x-tick label and rename it.
x_tick_labels = []
for l_date in x_dates:
    date_str = l_date.strftime('%b-%d')
    x_tick_labels.append(date_str)
ax.set(xticks=loaded_data['date'], xticklabels=x_tick_labels)


# Customize graph.
##########################
plt.xlabel('Date')
plt.ylabel('Price')
plt.title('Apple')

plt.gcf().autofmt_xdate()   # Beautify the x-labels
plt.autoscale(tight=True)

# Save graph to file.
plt.savefig('candlestick-no-weekend-gaps.png')
Output chart

Github
- https://github.com/xuanngo2001/python-examples/blob/master/matplotlib/candlestick/apple.csv
- https://github.com/xuanngo2001/python-examples/blob/master/matplotlib/candlestick/candlestick-no-weekend-gaps.py

