Overview
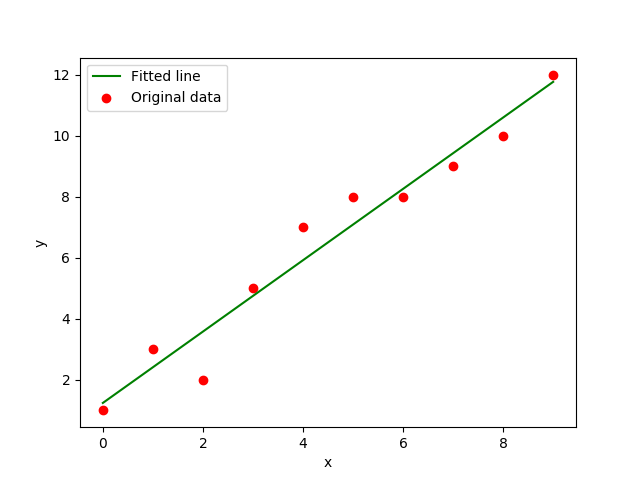
For financial chart, it is useful to find the trend of a stock price. In order to do this, we have to find a line that fits the most price points on the graph.

In mathematical term, we are calculating the linear least-squares regression. Our goal is to find the line function:
y(x) = b + slope*x
Install required libraries
# Install Matplotlib library to plot the graph.
pip install matplotlib

# Install SciPy library to get linregress().
pip install scipy
Calculate the linear least-squares regression
Luckily, SciPy library provides linregress() function that returns all the values we need to construct our line function. There is no need to learn the mathematical principle behind it. Here is an example.
#!/usr/bin/python3
import matplotlib
matplotlib.use('Agg')

import numpy as np
from scipy.stats import linregress
import matplotlib.pyplot as plt

# Your data points.
x = np.array([0, 1, 2, 3, 4, 5, 6, 7, 8, 9])
y = np.array([1, 3, 2, 5, 7, 8, 8, 9, 10, 12])

# Get slope, intercept from linregress() to plot y' = intercept + slope*x
(slope, intercept, rvalue, pvalue, stderr) = linregress(x,y)

# Plot data points
plt.scatter(x,y, color="red", marker="o", label="Original data")


# Plot linear regression line.
y_pred = intercept + slope*x
plt.plot(x,y_pred, color="green", label="Fitted line")

# Set labels
plt.legend(loc='best')
plt.xlabel('x')
plt.ylabel('y')

# Save result in file.
plt.savefig("scipy-linregress.png")

Github
- https://github.com/xuanngo2001/python-examples/blob/master/scipy/scipy-linregress.py

