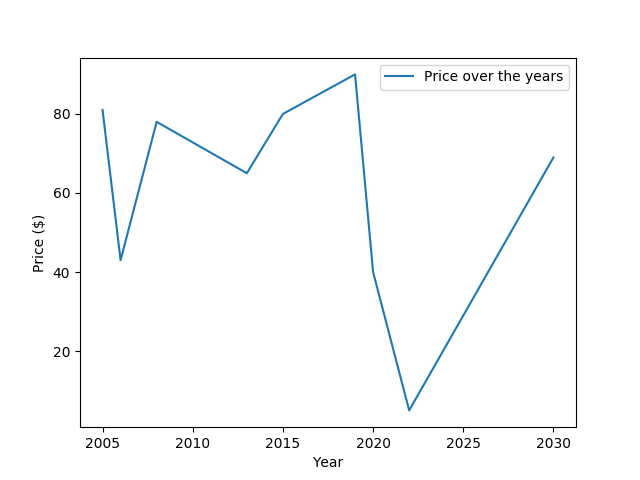
The example below shows the basic Pandas data frame structure and how it is fed to Matplotlib.
#!/usr/bin/python3
import matplotlib
matplotlib.use('Agg') # Bypass the need to install Tkinter GUI framework

import matplotlib.pyplot as plt
import pandas as pd

# Define pandas data frame.
df=pd.DataFrame()
df['year']  = [2005, 2006, 2008, 2013, 2015, 2019, 2020, 2022, 2030]
df['price'] = [  81,   43,   78,   65,   80,   90,   40,    5,   69]

# Plot chart.
(fig, ax) = plt.subplots()
x = df['year']
y = df['price']
ax.plot(x, y, label="Price over the years")

# Customize graph.
ax.set_xlabel("Year")
ax.set_ylabel("Price ($)")
ax.legend(loc='best')

# Save result to file.
plt.savefig('pandas-basic-matplotlib.png')
Chart output


