Overview
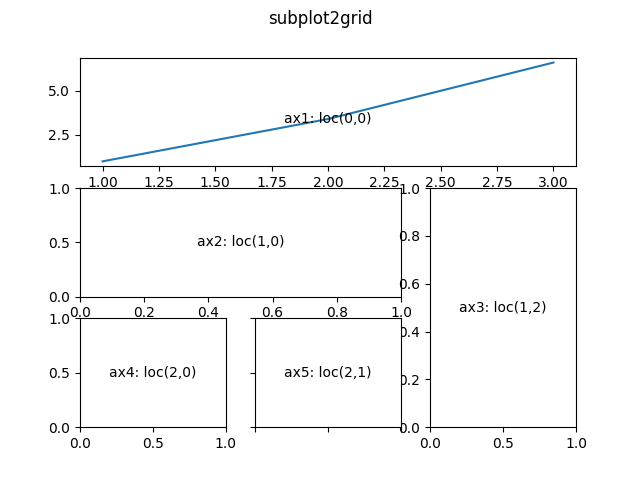
Using subplot2grid() function to plot multiple charts is easy. It will place your charts in a grid. The cells in the grid are placed from left to right and from top to bottom. For example, the first cell is located in the top left corner(0,0) whereas the last cell is located in bottom right corner(n,n). It takes at least the following input parameters:
- shape: The size of the grid: rows X columns. e.g. For a grid of the size 3 by 3, enter
(3,3). - loc: The location on the grid. The first index of loc is 0. e.g. To position a cell in the 2nd row at the 3rd column, enter
(1,2).
Usage example
#!/usr/bin/python3
import matplotlib
matplotlib.use('Agg') # Bypass the need to install Tkinter GUI framework
import matplotlib.pyplot as plt

# Main plot.
plt.figure(0)

# Create subplots using subplot2grid().
#   1st input pair is the grid size: 3 by 3.
#   2nd input pair is the location of the axis: (0,0) is the top left corner cell.
ax1 = plt.subplot2grid((3,3), (0,0), colspan=3)     # 1st row, 1st column. Expand width to 3 columns.
ax2 = plt.subplot2grid((3,3), (1,0), colspan=2)     # 2nd row, 1st column. Expand width to 2 columns.
ax3 = plt.subplot2grid((3,3), (1, 2), rowspan=2)    # 2nd row, 3rd column. Expand height to 2 rows.
ax4 = plt.subplot2grid((3,3), (2, 0))               # 3rd row, 1st column.
ax5 = plt.subplot2grid((3,3), (2, 1))               # 3rd row, 2nd column.

# Label the axes.
ax2.text(0.5, 0.5, "ax2: loc(1,0)", va="center", ha="center")
ax3.text(0.5, 0.5, "ax3: loc(1,2)", va="center", ha="center")
ax4.text(0.5, 0.5, "ax4: loc(2,0)", va="center", ha="center")
ax5.text(0.5, 0.5, "ax5: loc(2,1)", va="center", ha="center")

# Plot ax1.
x=[1, 2, 3]
y=[1, 3.4, 6.6]
ax1.plot(x, y)
ax1.text(2, 3.4, "ax1: loc(0,0)", va="center", ha="center")

# Remove x/y ticklabels for ax5.
plt.setp(ax5.get_xticklabels(), visible=False)
plt.setp(ax5.get_yticklabels(), visible=False)

# Add title to the main chart.
plt.suptitle("subplot2grid")

# Save graph to file.
plt.savefig('subplot2grid.png')
Output chart

Bonus
# Share x-axis between ax1 and ax2.
ax1.get_shared_x_axes().join(ax1, ax2)

# Hide tick labels
for label in ax1.get_xticklabels():
    label.set_visible(False)
# or
ax1.set_xticklabels([])

