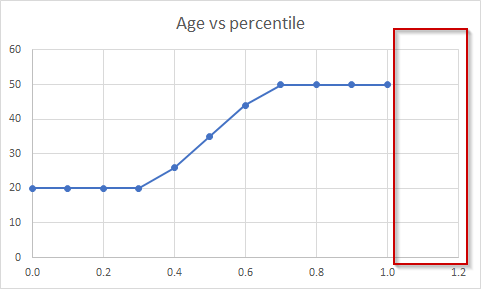
Charts generated by MS Excel are not always ideal. Especially, it generates the useless space at the end of the x-axis.

Here are the steps to set the maximum bound on the x-axis.
- Select your chart.
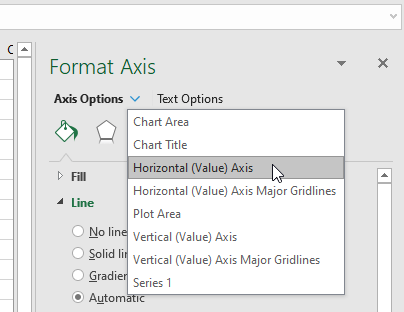
- Change the format axis to use Horizontal (Value) Axis.

- Select Axis Options.
- Set the Maximum bound.

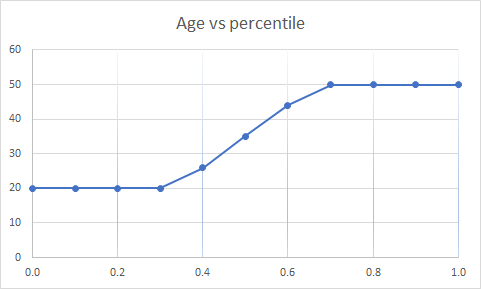
- Here is the result.

For y-axis, repeat the same steps but select Vertical (Value) Axis instead of Horizontal (Value) Axis.

