Overview
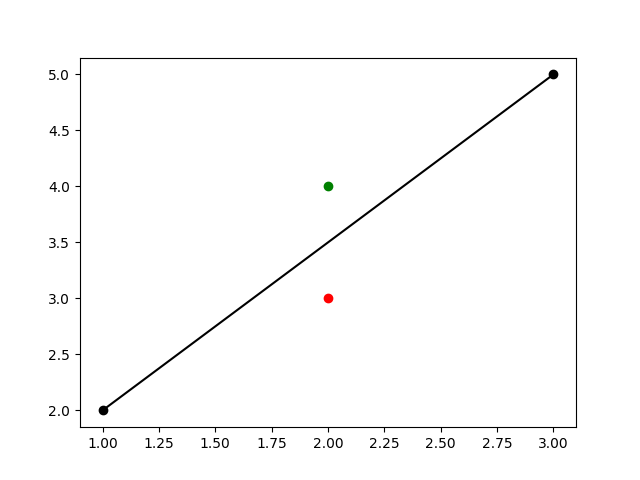
To find out whether a point is above or below a line, you have to use the cross product, a multiplication of 2 vectors. More information can be found at:
- https://math.stackexchange.com/a/274728
- https://stackoverflow.com/a/45769740
Code
#!/usr/bin/python3
# Ref: https://stackoverflow.com/a/45769740

import matplotlib
matplotlib.use('Agg') # Bypass the need to install Tkinter GUI framework

import numpy as np
import matplotlib.pyplot as plt

# Use cross product to determine whether a point lies above or below a line.
#   Math: https://math.stackexchange.com/a/274728
#   English: "above" means that looking from point a towards point b,
#               the point p lies to the left of the line.
is_above = lambda p,a,b: np.cross(p-a, b-a) < 0

# Data.
a = np.array([1,2]) # [x,y]
b = np.array([3,5]) # [x,y]

p1 = np.array([2,4]) # [x,y]
p2 = np.array([2,3]) # [x,y]


# Draw a b line.
(fig, ax) = plt.subplots()
data_points = np.array([a,b]) # Add points: (1,2) , (3,5)
data_points_x = data_points[:,0] # For every point, get 1st value, which is x.
data_points_y = data_points[:,1] # For every point, get 2nd value, which is y.
ax.plot(data_points_x, data_points_y, marker="o", color="k")

# Draw point: color point if it is above or below line.
# Point 1:
if is_above(p1,a,b):
    ax.scatter(p1[0], p1[1], color='green')
else:
    ax.scatter(p1[0], p1[1], color='red')

# Point 2:
if is_above(p2,a,b):
    ax.scatter(p2[0], p2[1], color='green')
else:
    ax.scatter(p2[0], p2[1], color='red')

# Save result to file.
plt.savefig('is-point-above-below-line.png')
Chart


