#!/usr/bin/python3
# Ref: https://matplotlib.org/gallery/text_labels_and_annotations/legend_demo.html
import numpy as np

import matplotlib
matplotlib.use('Agg') # Bypass the need to install Tkinter GUI framework
import matplotlib.pyplot as plt

# Create data.
xdata = np.arange(0.0, 2.0, 0.1)
ydata_left = np.sin(np.pi * xdata)
ydata_right = np.exp(xdata)*1000

# Create main axis.
(figure, main_axis) = plt.subplots()
line_main, = main_axis.plot(xdata, ydata_left, color='red')  # Get line returned for the legend.
main_axis.set_ylabel('sin(x)', color='red')
main_axis.tick_params(axis='y', labelcolor='red')

main_axis.set_xlabel('x') # Label shared x-axis.

# Create right axis.
right_axis = main_axis.twinx()  # Instantiate a second axes that shares the same x-axis.
line_right, = right_axis.plot(xdata, ydata_right, color='blue') # Get line returned for the legend.
right_axis.set_ylabel('exp(x)', color='blue')
right_axis.tick_params(axis='y', labelcolor='blue')

# Combine legends.
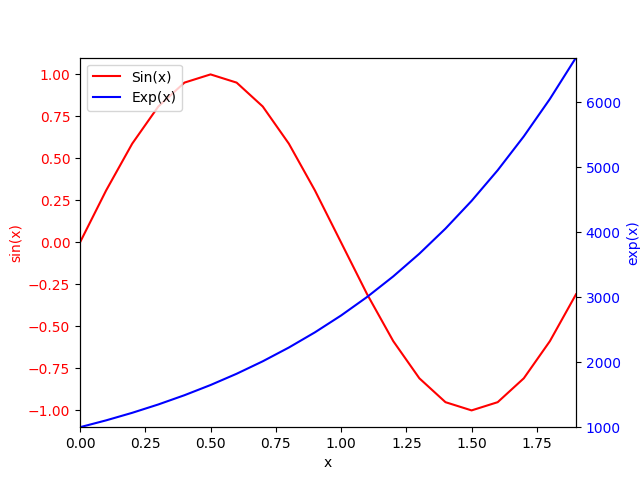
plt.legend([line_main, line_right], ['Sin(x)', 'Exp(x)'])

# Customize graph.
plt.autoscale(tight=True)

# Save graph to file.
plt.savefig('matplotlib-combined-legends.png')
Output chart


