Overview
Most of the matplotlib examples found on the Internet assume that Tkinter GUI framework is installed on your computer.
However, it is not installed on my computer. Without this framework, on the plt.show() statement, it will throw the following error:
ImportError: No module named '_tkinter', please install the python3-tk package
To avoid this error, simply save the result in an image file.
You simply need to call matplotlib.use('Agg') directive before importing pylab or pyplot.
This will instruct matplotlib to use Agg backend, which makes nice PNGs using the C++ Anti-Grain rendering engine.
Example to avoid installing Tkinter framework
#!/usr/bin/python3

import matplotlib
matplotlib.use('Agg') # Bypass the need to install Tkinter GUI framework

import matplotlib.pyplot as plt

# You data points.
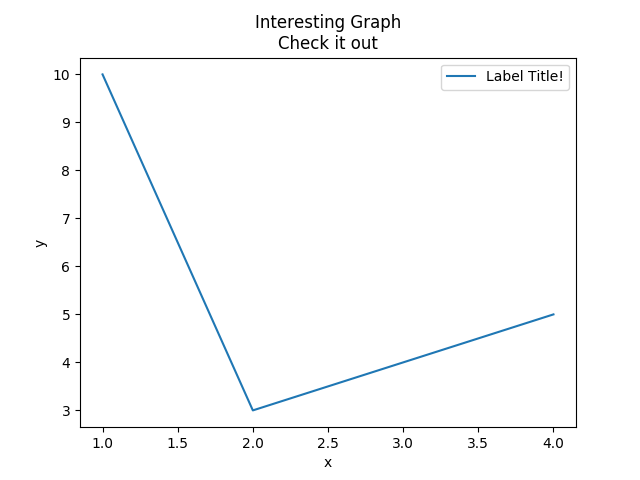
x = [1,  2, 3, 4]
y = [10, 3, 4, 5]

# Plot your data points.
plt.plot(x,y, label='Label Title!')

# Set graph labels & legend
plt.xlabel('x')
plt.ylabel('y')
plt.title('Interesting Graph\nCheck it out')
plt.legend()

#plt.show()

# Save graph to file.
plt.savefig('matplotlib-no-tinker.png')
Output


