When running a website, you will need to do some maintenance and upgrades works on your website. It is always good to know when it is a good time to do these tasks. When your website has the least traffic. So, that the interruption has the least impact on your users.
With Google Analytics, you can create custom reports to show what day of the week and the time that your website has the least traffic. I will show you how to create each report and another one that combines both of them.
Least traffic day of the week report
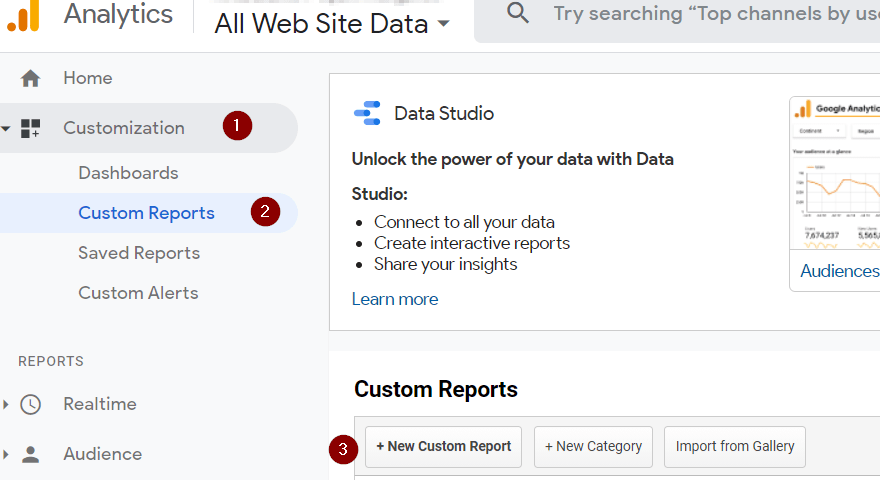
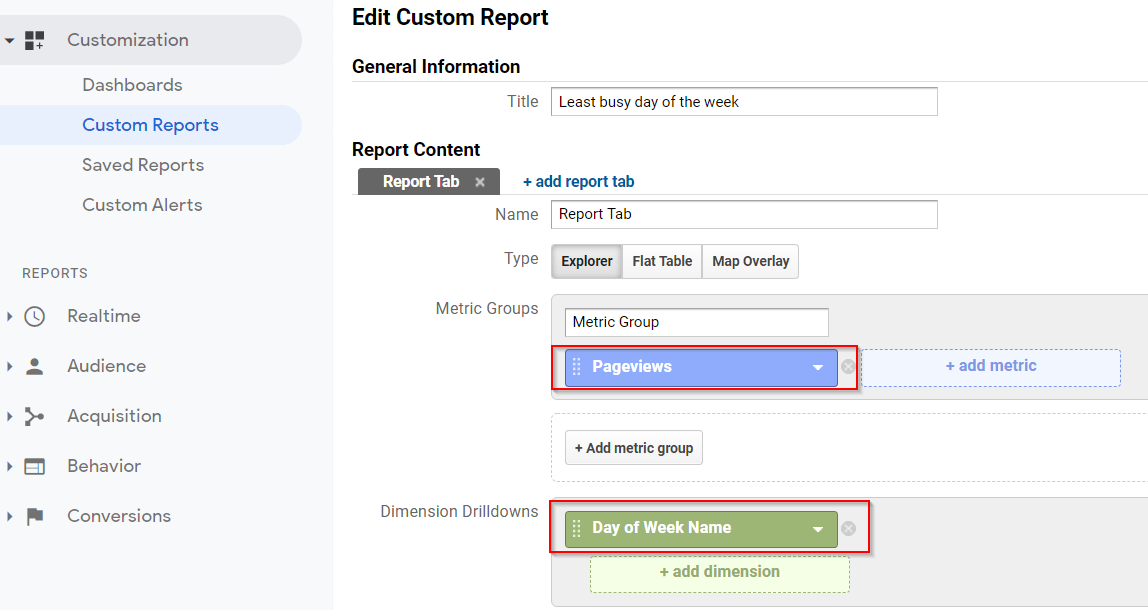
To create a report that shows the least traffic day of the week, you will need to add Pageviews in the Metric Group and Day of Week Name in the Dimension Drilldowns. Here are the steps.
- Navigate to Customization > Custom Reports and then click on the New Custom Report button to create a new custom report.
- Add Pageviews in the Metric Group and Day of Week Name in the Dimension Drilldowns.
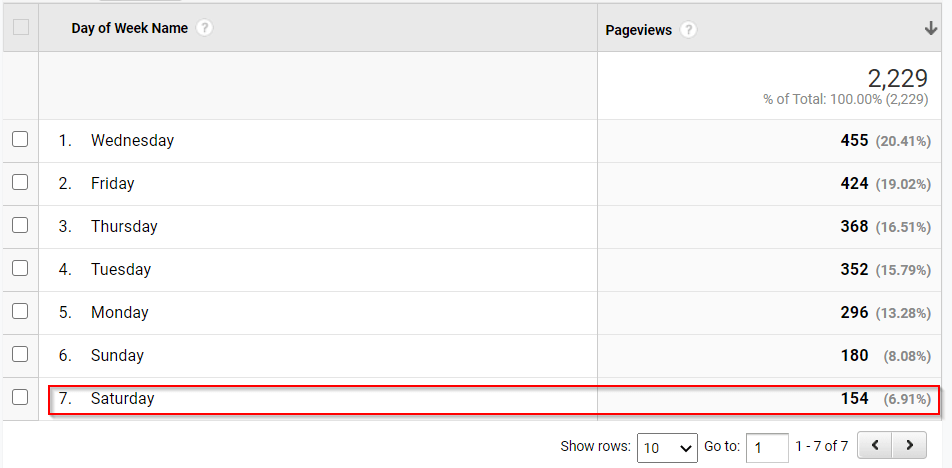
- For my case, the report below shows that my website has the least traffic on Saturday.
Least traffic time of the day report
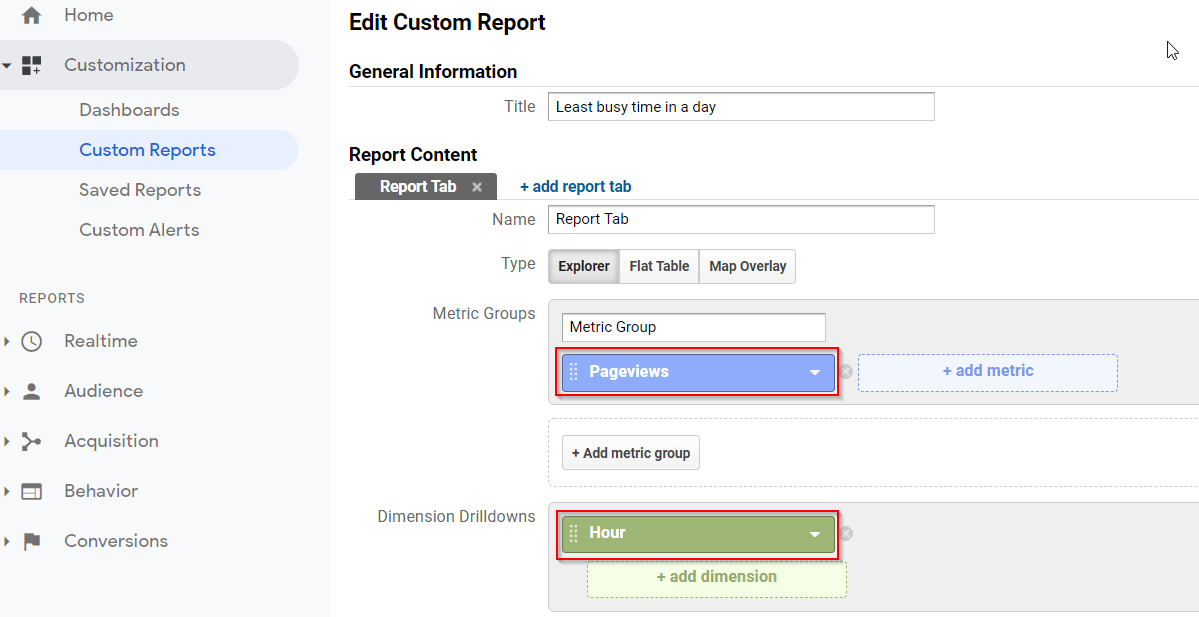
To create a report that shows the least traffic time of the day, you will need to add Pageviews in the Metric Group and Hour in the Dimension Drilldowns. Here are the steps.
- Navigate to Customization > Custom Reports and then click on the New Custom Report button to create a new custom report.

- Add Pageviews in the Metric Group and Hour in the Dimension Drilldowns.
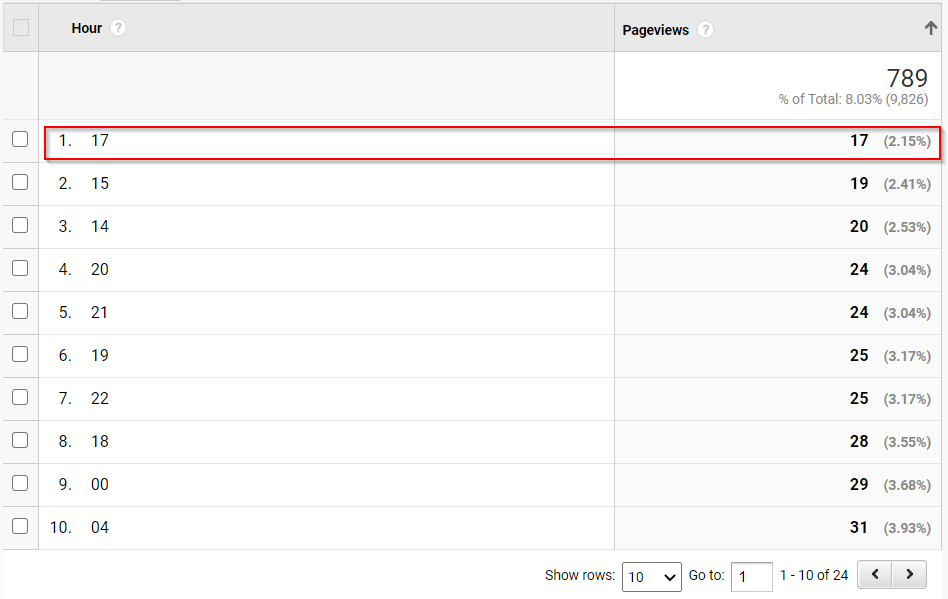
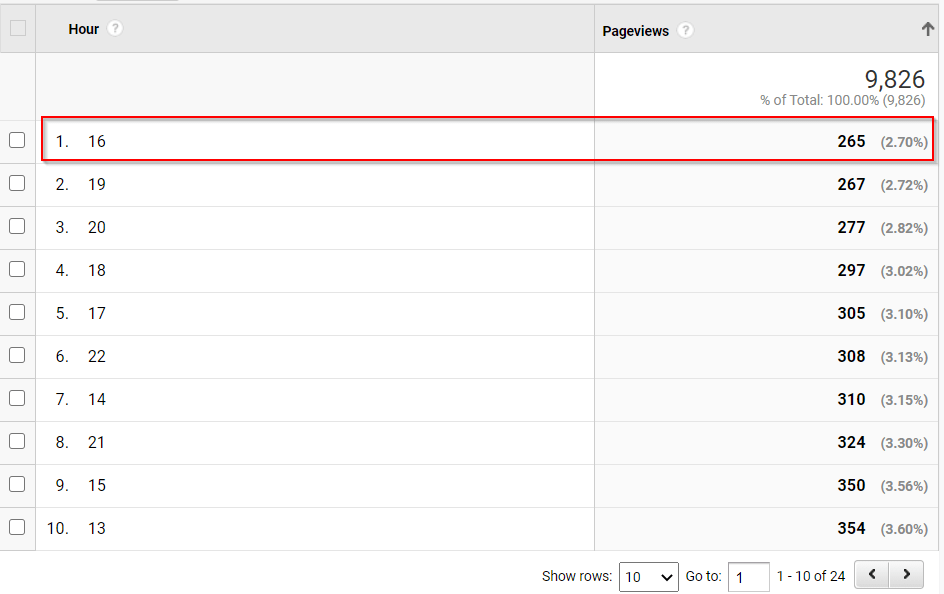
- For my case, the report below shows that my website has the least traffic at 4 PM. Please note that I sorted Pageviews in ascending order to get the result on the first row.
Least traffic day and time report
Having separate reports for the least traffic day of the week and for the least traffic time of the day might not be accurate. On that day of the week, the time might be different. So, we have to combine these 2 data together to get a better picture.
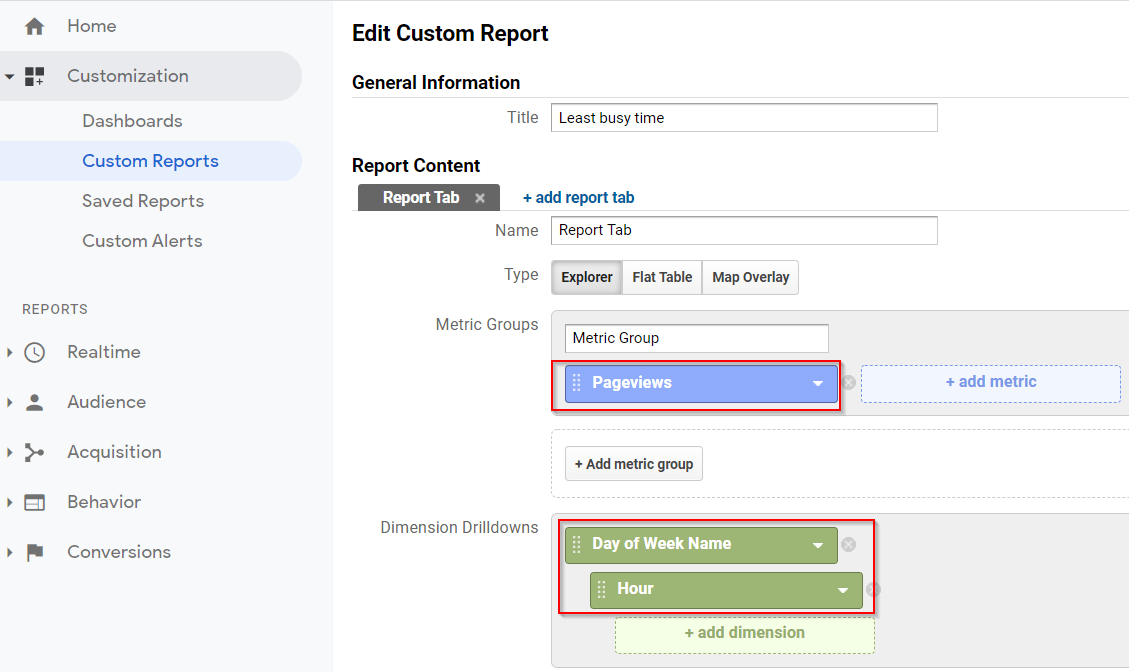
To create a report that shows the least traffic day and time of the week, you will need to add Pageviews in the Metric Group and add Hour as a sub level of Day of Week Name in the Dimension Drilldowns. Here are the steps.
- Navigate to Customization > Custom Reports and then click on the New Custom Report button to create a new custom report.

- Add Pageviews in the Metric Group and Day of Week Name in the Dimension Drilldowns.
- Click on +add dimension to add Hour as the sub level of Day of Week Name.
- For my case, the report below shows that my website has the least traffic on Saturday at 5 PM instead of 4 PM. Please note that I sorted Pageviews in ascending order to get the result on the first row.
