Overview
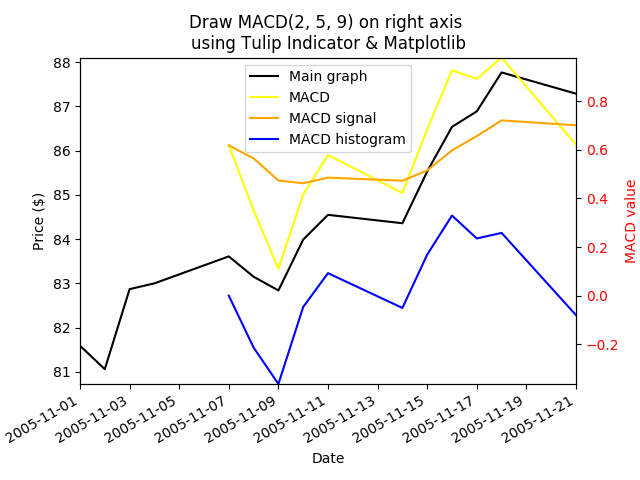
Here is a simple example showing how to use Tulip Indicators and Matplotlib to draw Moving Average Convergence/Divergence (MACD). The data used here is taken from https://tulipindicators.org/macd.
Requirement
- numpy, pandas, matplotlib, tulipy Python packages are installed on your system.
Code
#!/usr/bin/python3

import pandas as pd
import tulipy as ti

import matplotlib
matplotlib.use('Agg') # Bypass the need to install Tkinter GUI framework
import matplotlib.pyplot as plt

# Avoid FutureWarning: Pandas will require you to explicitly register matplotlib converters.
from pandas.plotting import register_matplotlib_converters
register_matplotlib_converters()


# Load data from CSV file.
##########################
my_headers = ['date', 'price']
my_dtypes = {'date': 'str', 'price': 'float'}
my_parse_dates = ['date']   # List columns that should be parsed as date.
loaded_data = pd.read_csv('data.csv', sep='\t', header=None, names=my_headers,
                            dtype=my_dtypes, parse_dates=my_parse_dates)

# Plot the main graph.
##########################
x = loaded_data['date']
y = loaded_data['price']

(fig, ax1) = plt.subplots()

ax1.set_xlabel('Date')
ax1.set_ylabel('Price ($)')
lax1, = ax1.plot(x, y, color='black', label='Main graph')

# Plot MACD.
##########################
short_period  = 2
long_period   = 5
signal_period = 9

# Calculate MACD.
macd_input=loaded_data['price'].values   # Convert pandas dataframe to NumPy array.
(macd, macd_signal, macd_histogram) = ti.macd(macd_input, short_period=short_period,
                                                            long_period=long_period,
                                                            signal_period=signal_period)
macd_x = loaded_data['date'].values
macd_x = macd_x[4:]   # Skip 1st 4 due to long_period=5.

ax2 = ax1.twinx()  # Instantiate a second axes that shares the same x-axis
ax2.set_ylabel('MACD value', color='red')
ax2.tick_params(axis='y', labelcolor='red')

# Draw macd values.
lax2_m1, = ax2.plot(macd_x, macd, color='yellow', label='MACD')
lax2_m2, = ax2.plot(macd_x, macd_signal, color='orange', label='MACD signal')
lax2_m3, = ax2.plot(macd_x, macd_histogram, color='blue', label='MACD histogram')


# Customize graph
##########################
# Set graph labels & legend
title='Draw MACD({}, {}, {}) on right axis \nusing Tulip Indicator & Matplotlib'.format(
                                                short_period, long_period, signal_period)
plt.title(title)
plt.legend([lax1, lax2_m1, lax2_m2, lax2_m3],
            ['Main graph', 'MACD', 'MACD signal', 'MACD histogram'])
plt.gcf().autofmt_xdate()   # Beautify the x-labels
plt.autoscale(tight=True)

# Save graph to file.
plt.savefig('macd-right-axis-tulip-matplotlib.png')
Output chart

Input data: data.csv
2005-11-01  81.59
2005-11-02  81.06
2005-11-03  82.87
2005-11-04  83.00
2005-11-07  83.61
2005-11-08  83.15
2005-11-09  82.84
2005-11-10  83.99
2005-11-11  84.55
2005-11-14  84.36
2005-11-15  85.53
2005-11-16  86.54
2005-11-17  86.89
2005-11-18  87.77
2005-11-21  87.29

